Metrics that mislead (and what to track instead)

Stop reporting activity. Start proving impact.
Happy Tuesday. This week’s note is about measurement discipline—how to avoid vanity metrics and build dashboards leaders can trust.
The idea in 30 seconds
When transformation loses credibility, it’s often because the metrics are impressive but irrelevant: clicks, logins, alerts fired. Measure what drives decisions—especially reliability and burden.
The framework
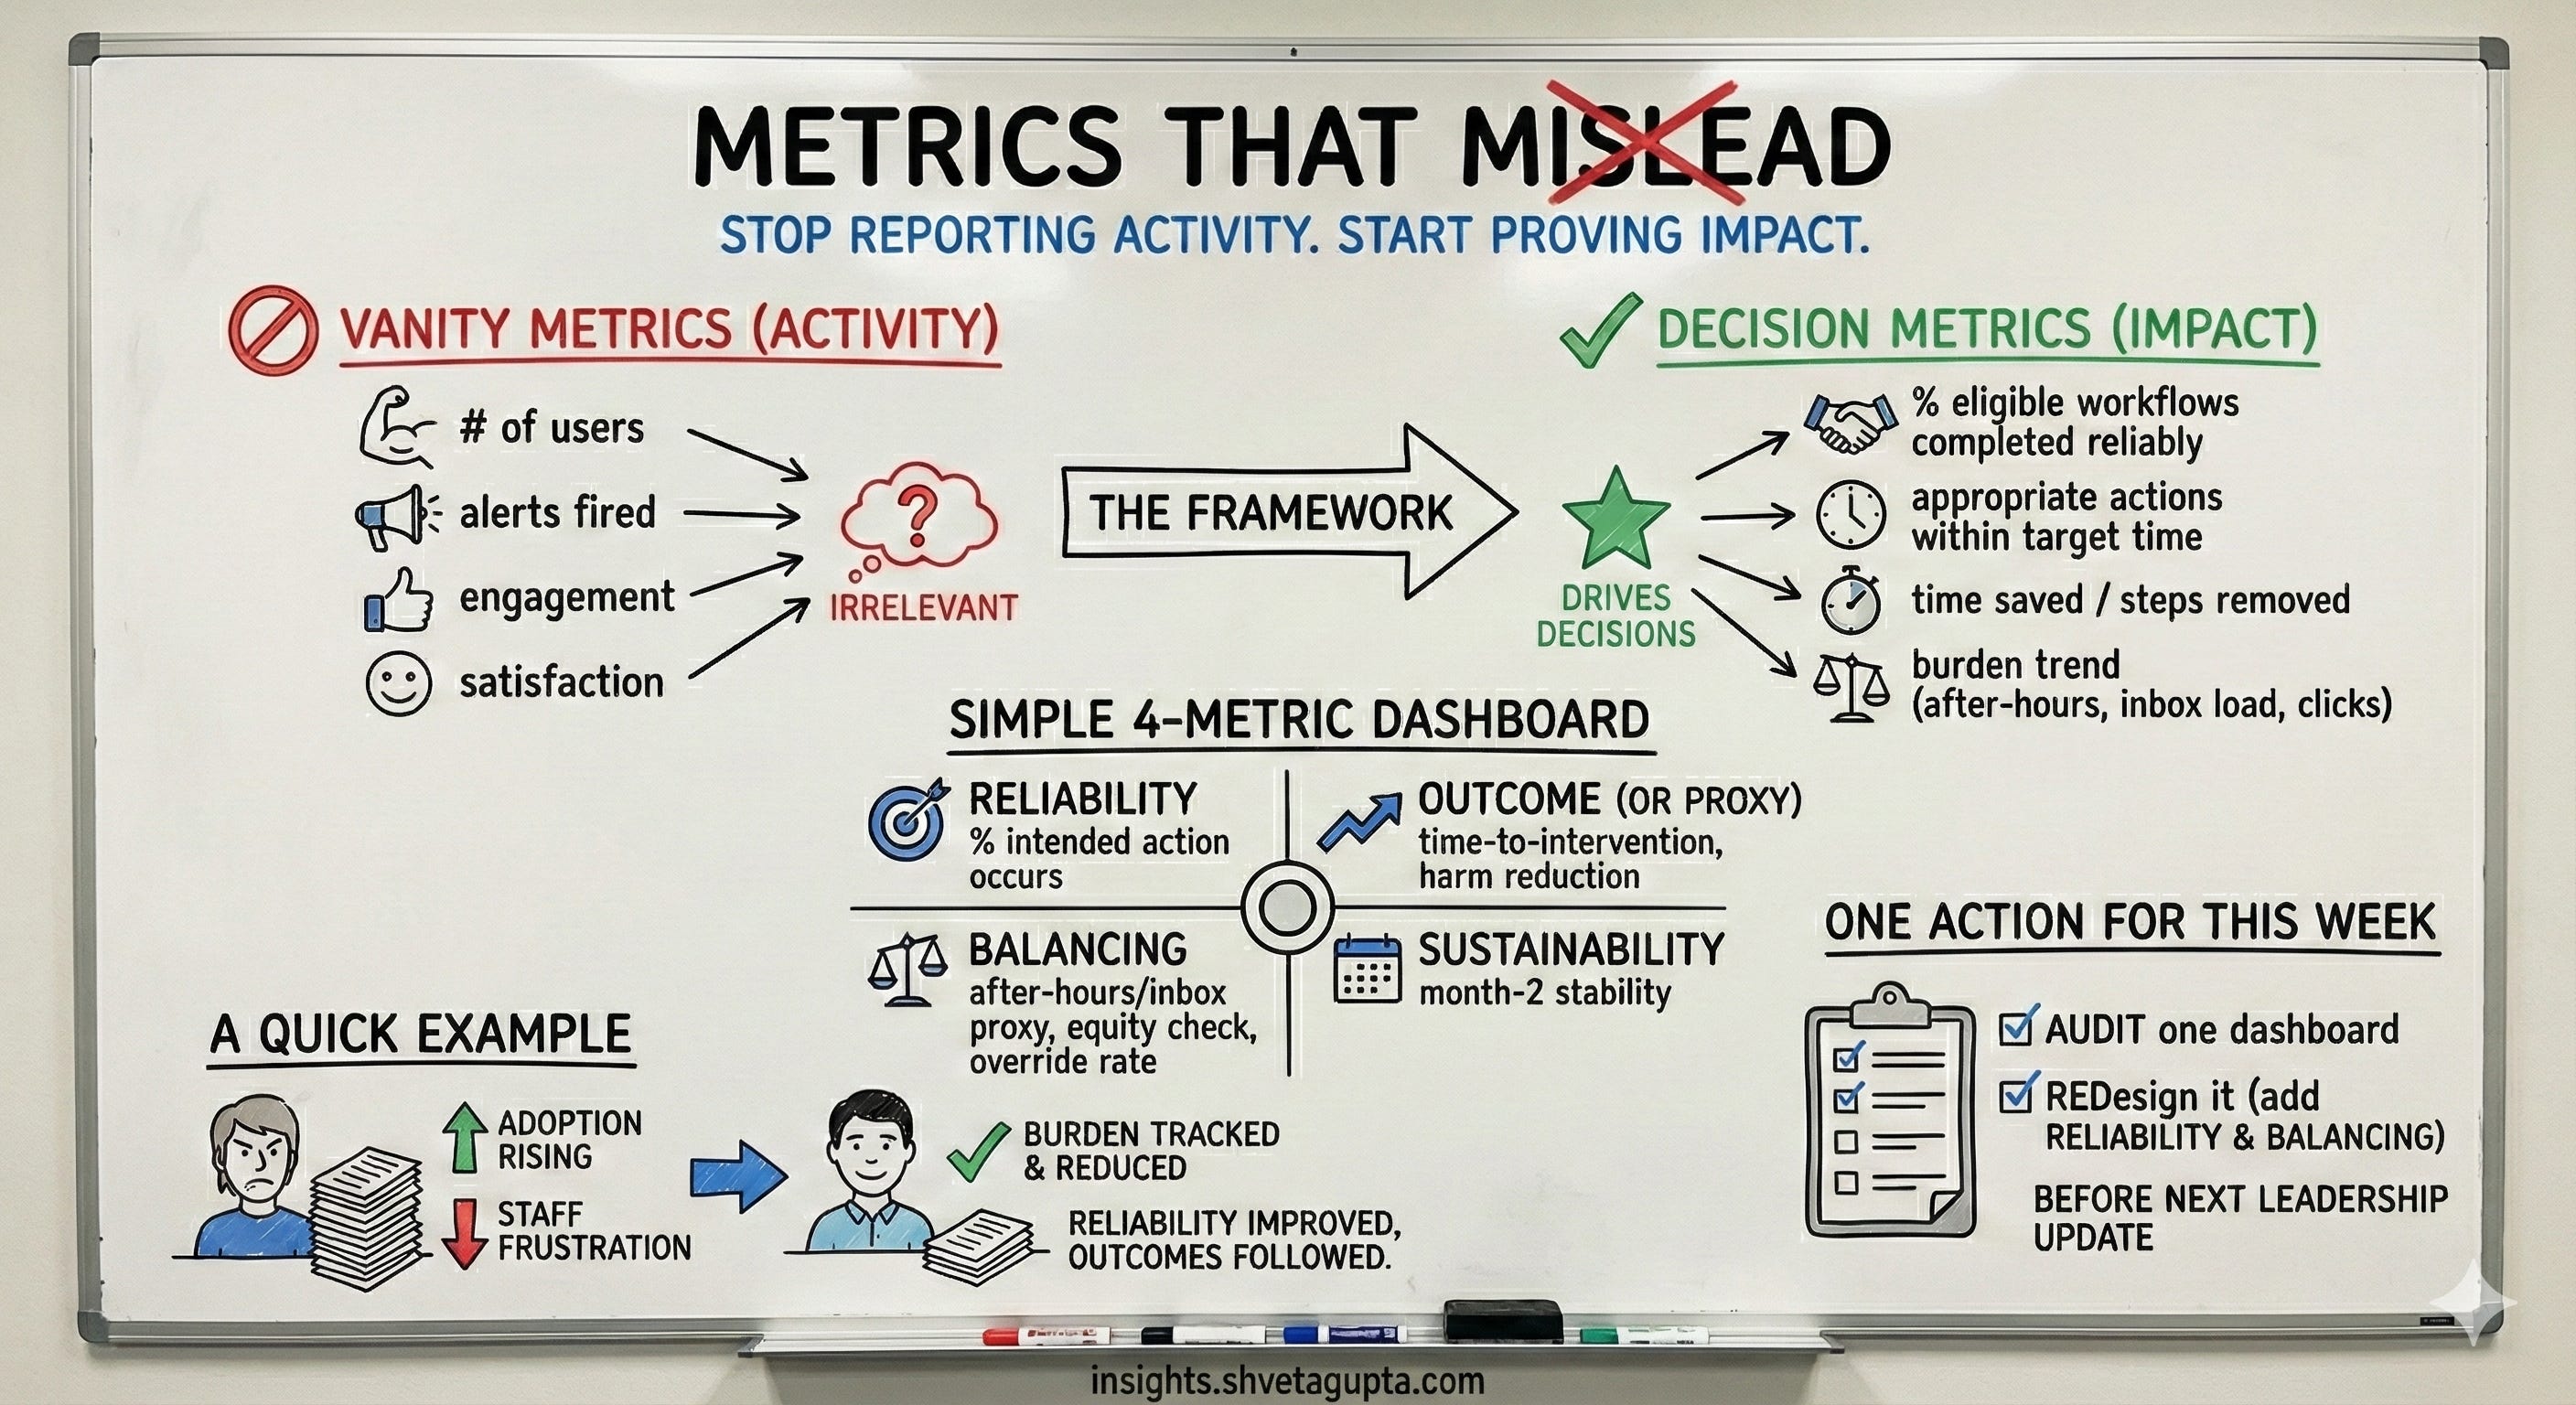
Replace vanity metrics with decision metrics:
“# of users” → % eligible workflows completed reliably
“alerts fired” → appropriate actions within target time
“engagement” → time saved / steps removed
“satisfaction” → burden trend (after-hours, inbox load, clicks)
A simple 4-metric dashboard:
Reliability metric
Outcome metric (or proxy)
Balancing metric (burden/equity/unintended effects)
Sustainment metric (month-2 stability)
A quick example
An initiative reported rising adoption while staff frustration grew. The missing metric was burden. Once burden was tracked and reduced (timing + routing + fewer clicks), reliability improved and outcomes followed.
How to measure it
Pick one of each:
Reliability: % intended action occurs
Outcome/proxy: time-to-intervention, harm reduction, readmission proxy
Balancing: after-hours/inbox proxy, equity check, override rate
Sustainment: month-2 reliability stability
One action for this week
Audit one dashboard. If it lacks reliability and a balancing metric, redesign it before the next leadership update.
Subscribe/share: https://insights.shvetagupta.com